The Million Unsold Nights: What Shadow Inventory Reveals
24 Jun 2026, 13:46 · by i.zuhuree · 7 min read · Tourism · EN

Maldives tourism must track unused bed-night capacity because rising shadow inventory creates pricing pressure, channel dependence, cash-flow risk, and long-term quality concerns.
Free tourism insights
Get Free Tourism Insights
Receive selected MTO insights, tourism data alerts, and new resource updates by email.
Get Free Tourism InsightsToday I want to begin with the invisible bed. Not the bed that was sold. Not the bed that appeared in a booking engine, a voucher, or a resort PMS. I mean the bed-night that existed in the tourism system but remained unused.
This is the quiet side of tourism capacity. It is not dramatic. It does not produce a headline. But it may be one of the most important indicators for understanding unused tourism capacity.
That unused capacity is what I call the shadow inventory. It is the part of the tourism economy that has already been built, staffed, financed, marketed, cooled, cleaned, and connected to transport systems — but has not yet been converted into a paid guest night.
A destination can ignore this shadow inventory when demand is strong, during the peak season. Operators can live with it when margins are healthy. Investors can discount it when growth expectations are high. But when unused capacity rises, the industry starts to feel it everywhere: in rates, cash flow, staffing, commissions, maintenance, debt service, and local spillovers.
The equation behind the story
The basic equation is simple:
Occupancy = Bed nights sold ÷ Bed night capacity
Uₜ = Dₜ / Kₜ
Where:
Uₜ = utilisation or occupancy in month t
Dₜ = demand, measured as bed nights sold
Kₜ = capacity, measured as bed-nights available for sale
This is more useful than a general discussion of tourism growth because it separates two forces that often move together but do not always move at the same speed. Demand is what the market used. Capacity is what the system offered. The gap between them is the hidden pressure.
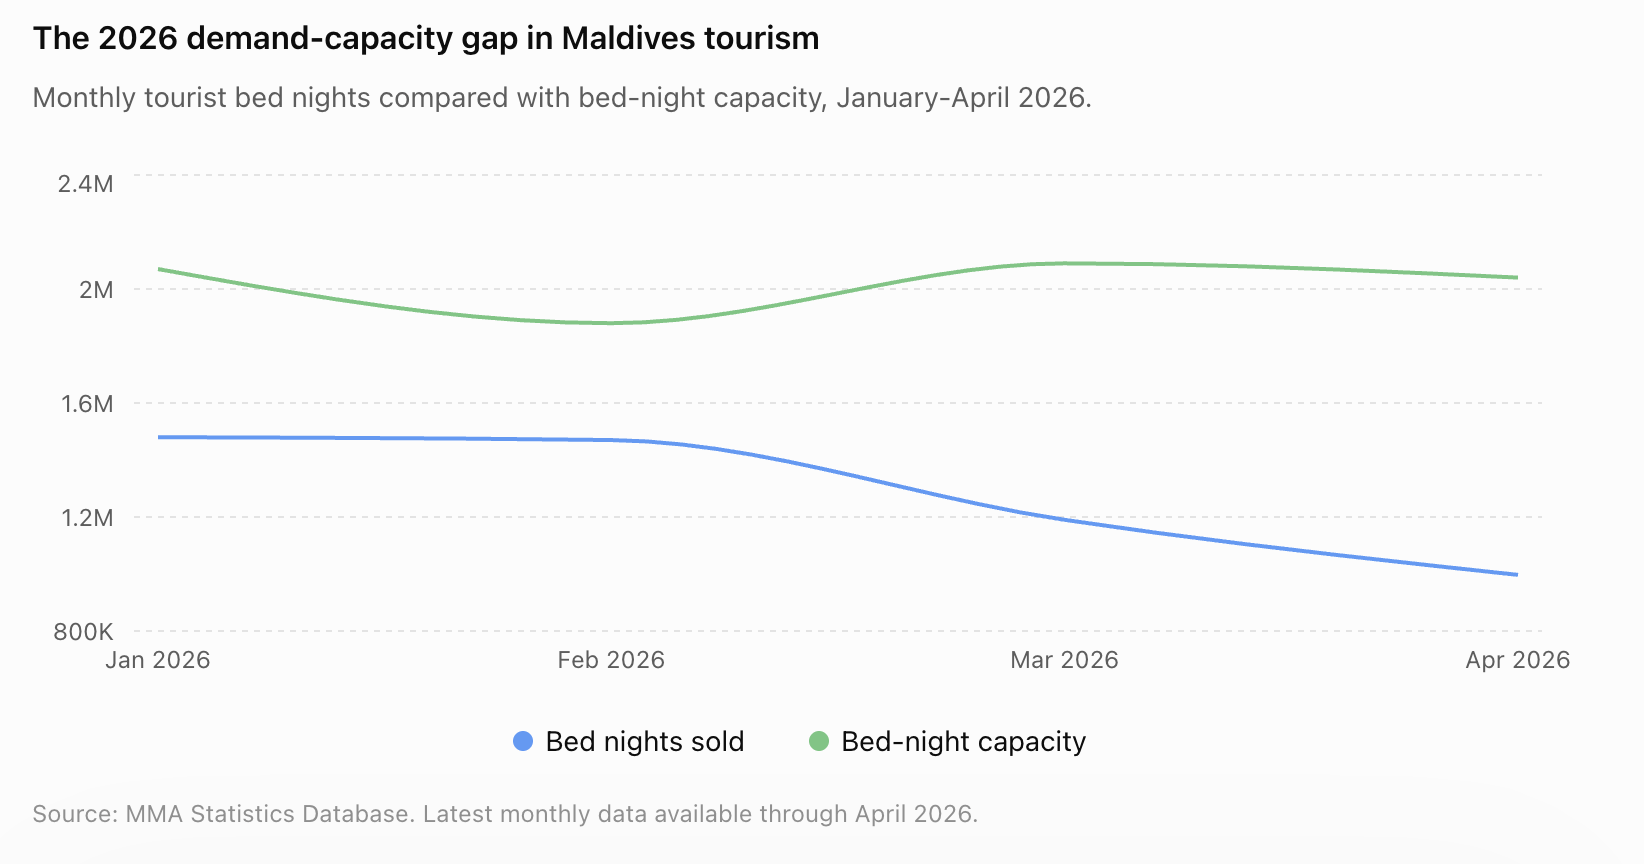
So I introduce a second equation:
Shadow inventory = Bed night capacity − Bed nights sold
Sₜ = Kₜ − Dₜ
In April 2026, official tourism indicators show roughly 2.04 million bed-nights of capacity and about 997,000 bed nights sold.
So:
S = 2.04 million − 0.997 million
S ≈ 1.04 million unused bed-nights
Lost Revenue
With 66% [1] of those beds belongs to resorts with booking.com median quoted price (2) of USD 575 , and guesthouse median quoted price of USD 72
LRr = USD 395 million
LRgh = USD 25 million
Above calculation deserves attention. It means that in one month, the Maldives tourism system had more than one million sellable bed-nights that were not converted into actual demand. Together, this gives a rough potential gross room-revenue exposure of about USD 420 million for April 2026 alone.
Above value should not be read as exact “lost revenue.” Quoted prices are not realised prices, not every unsold night could realistically have been sold, and accommodation types differ widely. But as a pressure indicator, the calculation is powerful. It shows the scale of value sitting between capacity and actual demand.
A different way to see tourism
Tourism is usually imagined as movement of services: aircraft landing, speedboats leaving the airport, luggage arriving at jetties, etc. But from an operator’s point of view, tourism is also inventory.
A room-night is a perishable good. It cannot be stored and sold later. If a bed-night is empty tonight, it disappears by morning. There is no warehouse for yesterday’s unsold tourism capacity.
This gives tourism its distinctive operating pressure.
A shop can hold unsold inventory. A resort cannot hold unsold nights. A guesthouse cannot move April’s empty room-nights into December. A safari vessel cannot recover a missed cabin-night after the boat has sailed.
This is why the shadow inventory matters. It is not just unused space. It is expired opportunity.
Capacity Pressure Index
The first four months of 2026
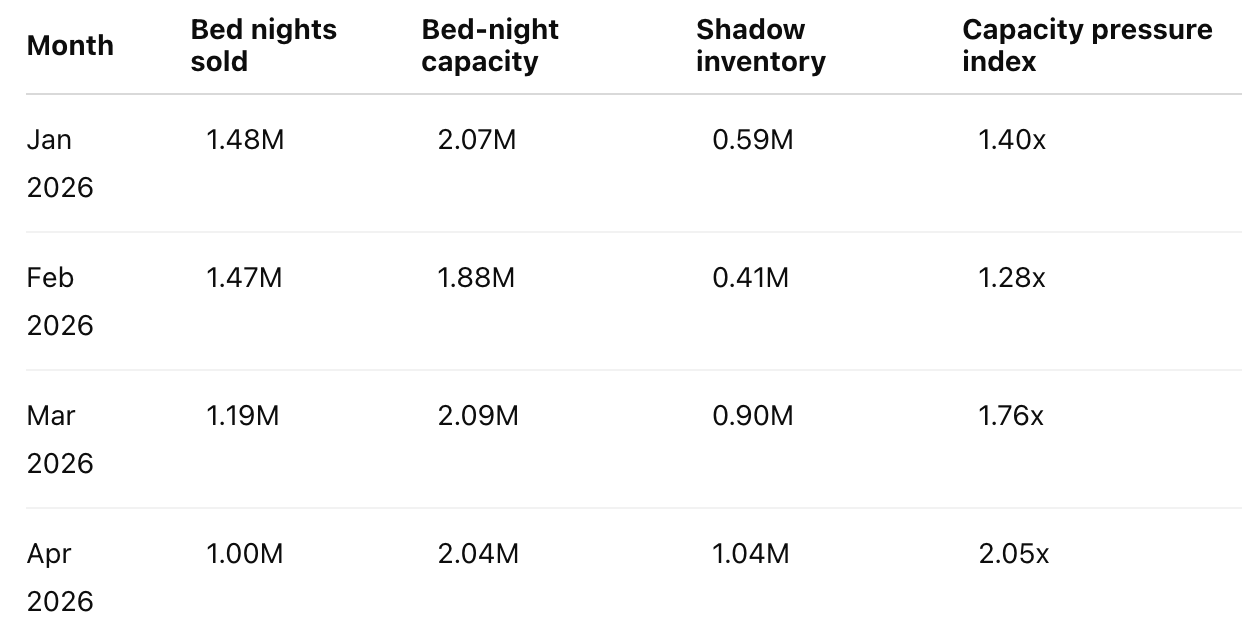
The most interesting number here is the capacity pressure index:
Capacity pressure index = Bed-night capacity ÷ Bed nights sold
Pₜ = Kₜ / Dₜ
If the index is 1.0, all capacity is used.
If it is 2.0, the system has two available bed-nights for every bed-night sold.
In January 2026, the pressure index was about 1.40. In February, it improved to about 1.28. By March, it rose to about 1.76. In April, it reached about 2.05. The real story is by April, the Maldives tourism system had slightly more than two available bed-nights for every bed-night actually sold.
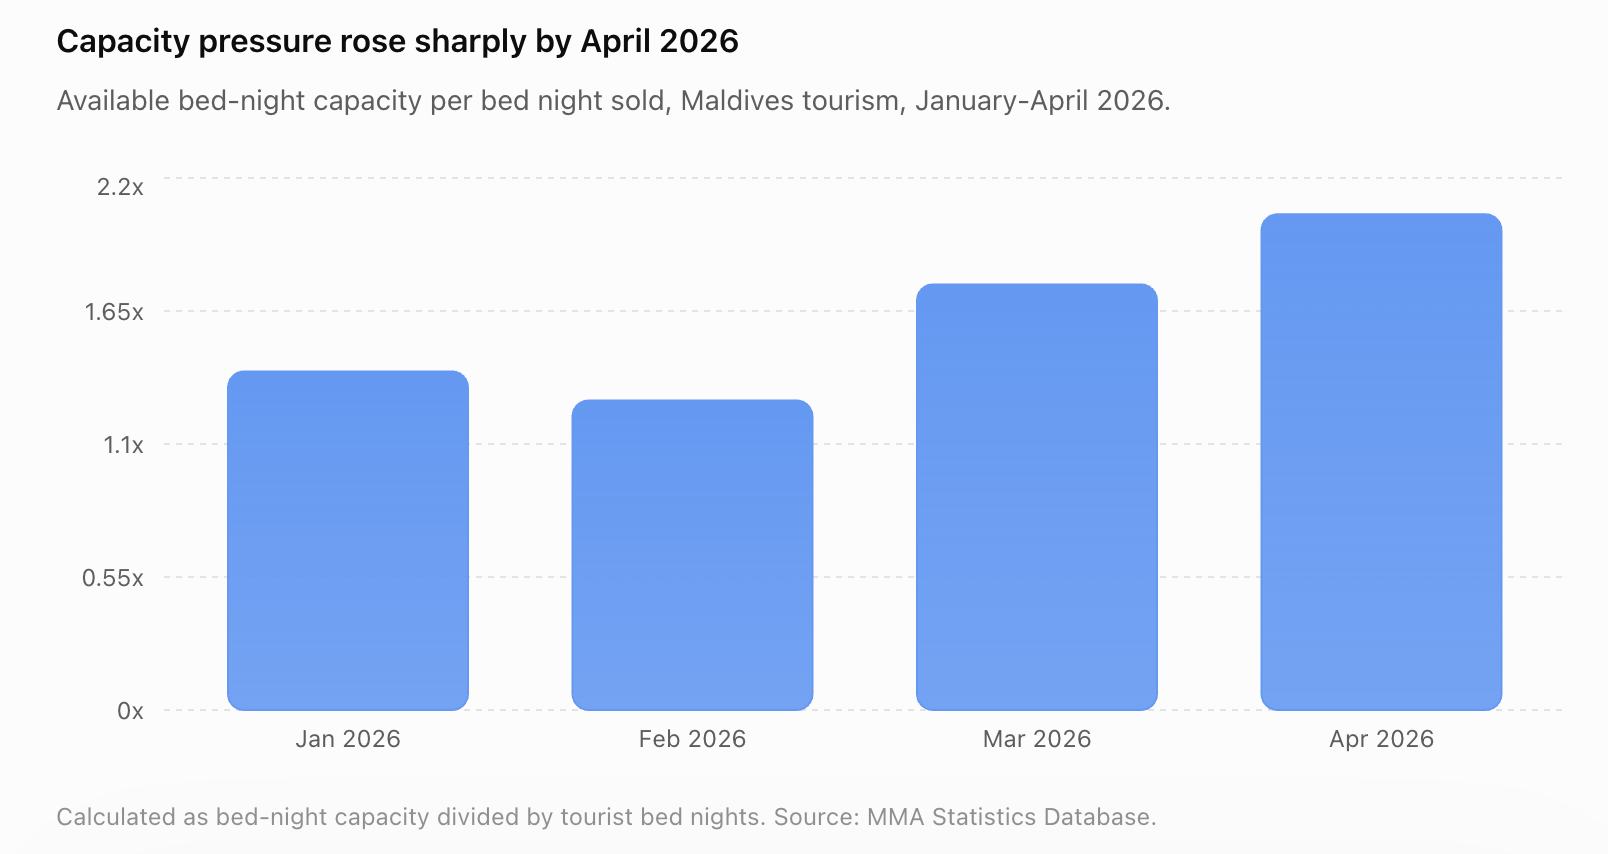
This is a more precise way of describing operating pressure than simply saying occupancy declined. Occupancy tells us the percentage used. The pressure index tells us how much supply was chasing each unit of demand.
For operators, that is the number that feels real.
What shadow inventory does to operators
Unused capacity behaves like gravity. At first it is invisible. Then slowly, everything bends around it. When shadow inventory rises, operators tend to experience four kinds of pressure.
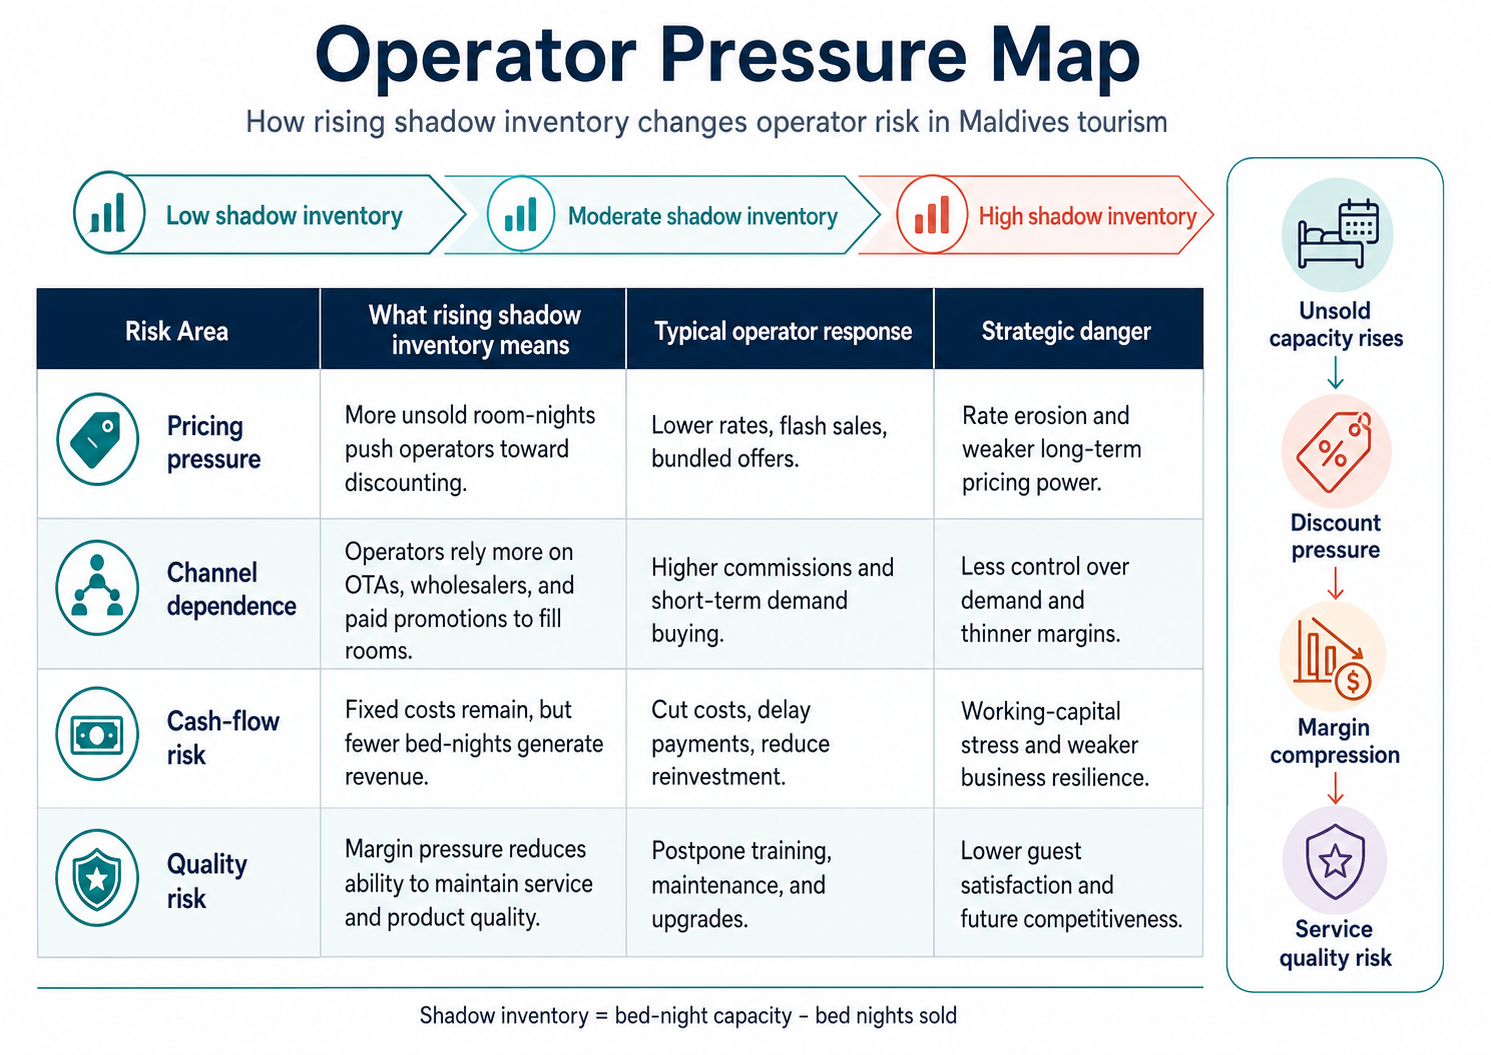
First, pricing pressure. Empty nights encourage discounting. If many properties discount at the same time, the market can reset downward. Second, channel pressure. Operators may rely more heavily on OTAs, wholesalers, flash sales, or promotional campaigns. Demand is purchased, but often at a higher commission cost. Third, cash-flow pressure. Tourism has high fixed costs: staff, utilities, maintenance, leases, insurance, transport arrangements, and financing. Empty nights reduce the revenue available to cover those costs. Fourth, quality pressure. When margins weaken, operators may postpone training, maintenance, refurbishment, staff welfare, environmental upgrades, or service improvements. This can reduce future competitiveness.
This is why shadow inventory is not merely an accounting concept. It is a strategic warning signal.
The policy angle
For policymakers, the shadow inventory raises a difficult but necessary question: Should the national tourism strategy continue treating capacity expansion as an automatic good? More rooms can support growth. But if additional capacity grows faster than usable demand, the result may be lower utilisation, weaker margins, and more pressure on public infrastructure and environmental systems.
The question is not whether the Maldives should stop expanding. That would be too simplistic. The better question is:
Where does new capacity add value, and where does it dilute value?
A new room in an underserved segment, with strong access, clear positioning, environmental safeguards, and demand depth may strengthen the tourism economy. A new room in an already crowded, weakly differentiated market may simply redistribute existing demand across more operators. That distinction matters for leases, land allocation, guesthouse approvals, island planning, infrastructure investment, marketing strategy, and financing.
The investor’s version of the equation
For investors, the equation can be rewritten as a feasibility test.
Required bed nights = Fixed costs + target return ÷ net revenue per bed-night
This is not a perfect formula, but it changes the starting point. Many tourism investment conversations begin with land, concept, room count, and projected occupancy. They should begin with required bed nights.
How many paid nights does this asset need to survive? How many paid nights does it need to generate a return? How many paid nights can the island realistically produce in low season? How many paid nights are already being absorbed by existing properties?
If the required bed nights exceed realistic demand, the investment case is weak even if the island is beautiful.
Beauty is not a feasibility model.
What is New and How can MTO Help?
The Maldives has long been studied through demand. How many tourists came? Which source markets grew? Which countries declined? Which month was stronger? Those questions remain useful. But they are no longer enough. A mature tourism economy must also study the structure of supply.
How much capacity exists? How much of it is operational? How much is registered but weakly utilised?
Where is capacity concentrated? Which accommodation types are absorbing demand? Which islands are carrying excess inventory? Where is capacity growth creating value, and where is it creating price pressure?
This is exactly the type of analytical layer I want to build into the Maldives Tourism Observatory. The Observatory is ready to work with the industry and government to identify new indicators and pressure points. This would allow operators, investors, councils, policymakers, and researchers to see not only whether tourism is growing, but whether the system is using its capacity productively.
That is the difference between data and intelligence. Data says: April 2026 occupancy was 48.9%.
MTO Intelligence asks: what happened to the other 51.1% of capacity, where was it located, who carried the financial pressure, and what decisions should follow?