Guesthouse Pricing Series: When Should You Raise or Lower Your Room Rate?
24 Jul 2026, 04:29 · by IzuCT · 17 min read · Tourism · EN

Room pricing should respond to booking pace, lead time and remaining inventory—not anxiety. By comparing pickup with forecast, guesthouses can raise rates confidently, protect strong dates and improve visibility or value before discounting weaker periods.
Free tourism insights
Get Free Tourism Insights
Receive selected MTO insights, tourism data alerts, and new resource updates by email.
Get Free Tourism InsightsThe first three articles in this series established the foundations of a workable pricing system. Together, these articles answer three essential questions: What does the room cost to provide? How much revenue remains after deductions? Where does the property sit within the market?
This article introduces the next question: When should the room rate change? This question is important because a guesthouse room has a hidden clock.
Six months before arrival, the room is an opportunity. Six days before arrival, it may be a risk. At sunset on the arrival date, an unsold room becomes something stranger: Shadow Inventory, carried costs and then vanished without earning anything.
This is why the correct room rate cannot remain fixed throughout the year. The rate should change when the evidence changes—not whenever a competitor discounts, an owner becomes anxious or an online platform recommends a promotion.
Revenue management gives operators a more disciplined question: Is this arrival date booking faster or slower than expected?
The central decision rule is: Booking pace above forecast: raise the rate or close the cheapest offer. Booking pace below forecast: improve visibility and value before discounting.
Dynamic pricing does not mean changing prices randomly
Dynamic pricing is the controlled adjustment of rates according to expected demand, booking progress, remaining inventory and the time left before arrival. It does not require expensive software. A small guesthouse can begin with a spreadsheet, a calendar and a weekly review.
International hotel revenue-management practice is built around forecasting, booking curves, pickup, market segmentation, availability controls and length-of-stay decisions. Cornell’s revenue-management framework emphasises moving beyond occupancy alone and considering revenue per available room, forecast demand and the opportunity cost of selling a room today rather than preserving it for potentially higher-value demand.
For a guesthouse, dynamic pricing can be as simple as:
one public starting rate;
five or six planned price levels;
expected booking progress for each arrival date;
clear rules for moving upward or downward; and
limits on discounts and restricted offers.
1. Start with the Maldives demand calendar
The Maldives is open throughout the year, but demand is not evenly distributed.
Monthly data for 2025 show national accommodation occupancy reaching 77.7% in February and falling to 39.3% in June. The seasonal pattern therefore remained consistent with the Ministry’s identification of November to March as the principal peak period and May to July as the lower-demand period. The long-term monthly averages add important context.
Figure 1. long-term monthly averages
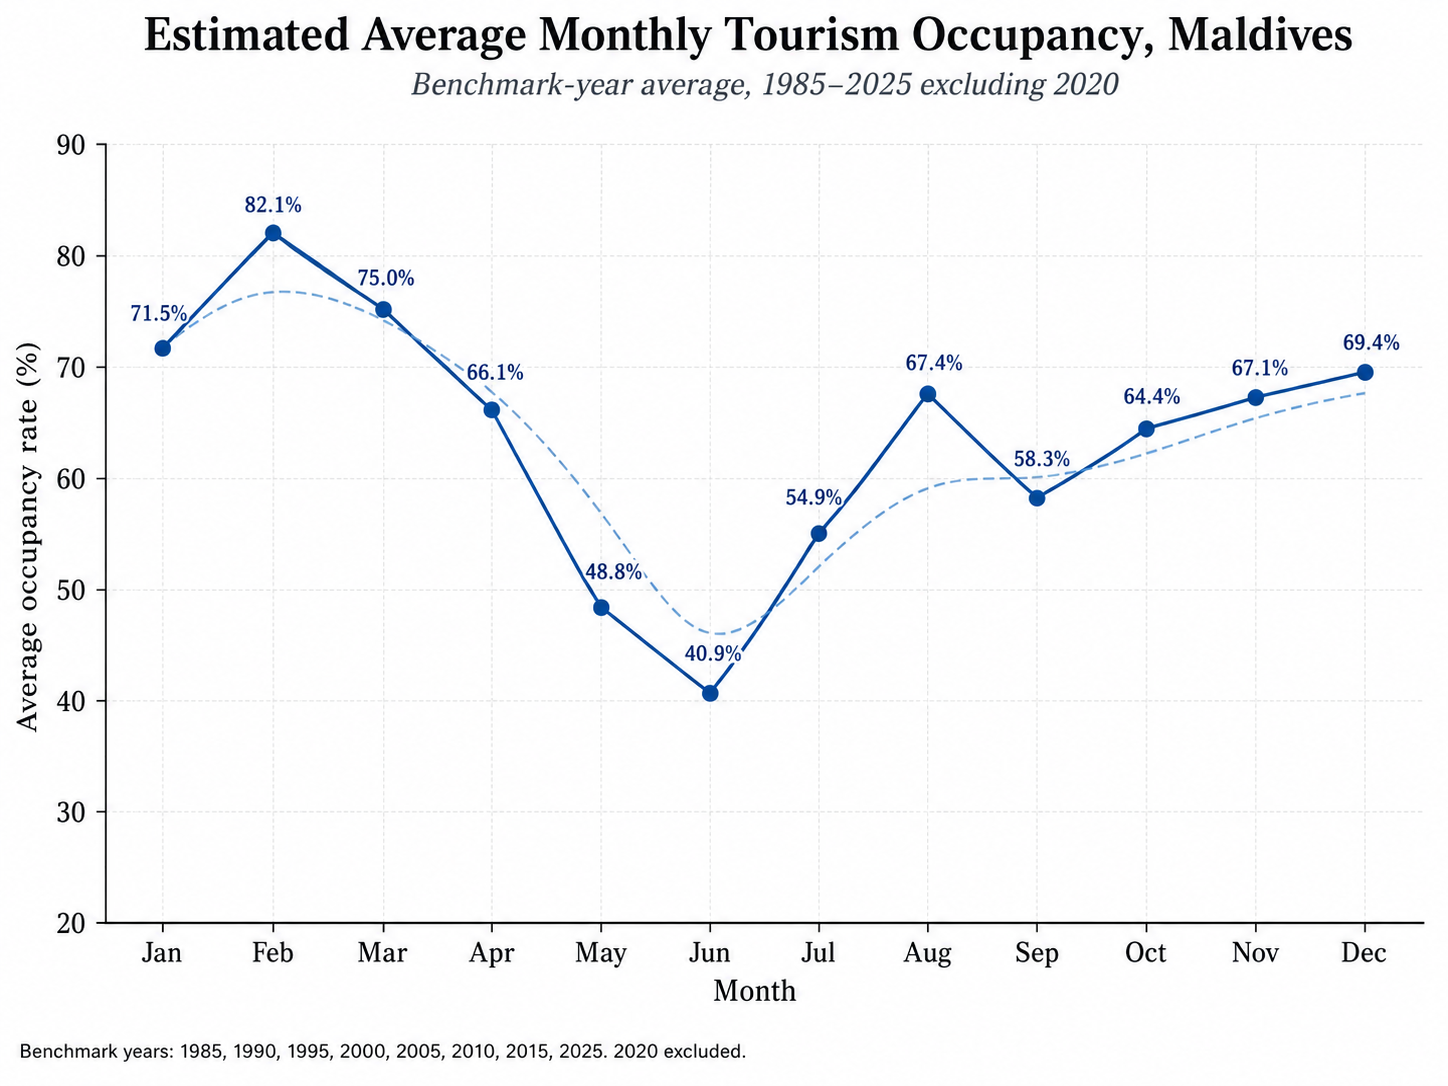
Across the benchmark years from 1985 to 2025, excluding the exceptional year of 2020, national occupancy typically rises from 71.5% in January to a February peak of 82.1%. It then falls steadily through March and April, reaching 48.8% in May and the annual low of 40.9% in June. Occupancy recovers to 54.9% in July and 67.4% in August, weakens again to 58.3% in September, and gradually strengthens towards 69.4% in December.
This smooth seasonal curve shows that even at the national level, demand is not evenly distributed throughout the year. February’s average occupancy is roughly twice that of June. A room offered in February is therefore entering a very different market from the same room offered four months later.
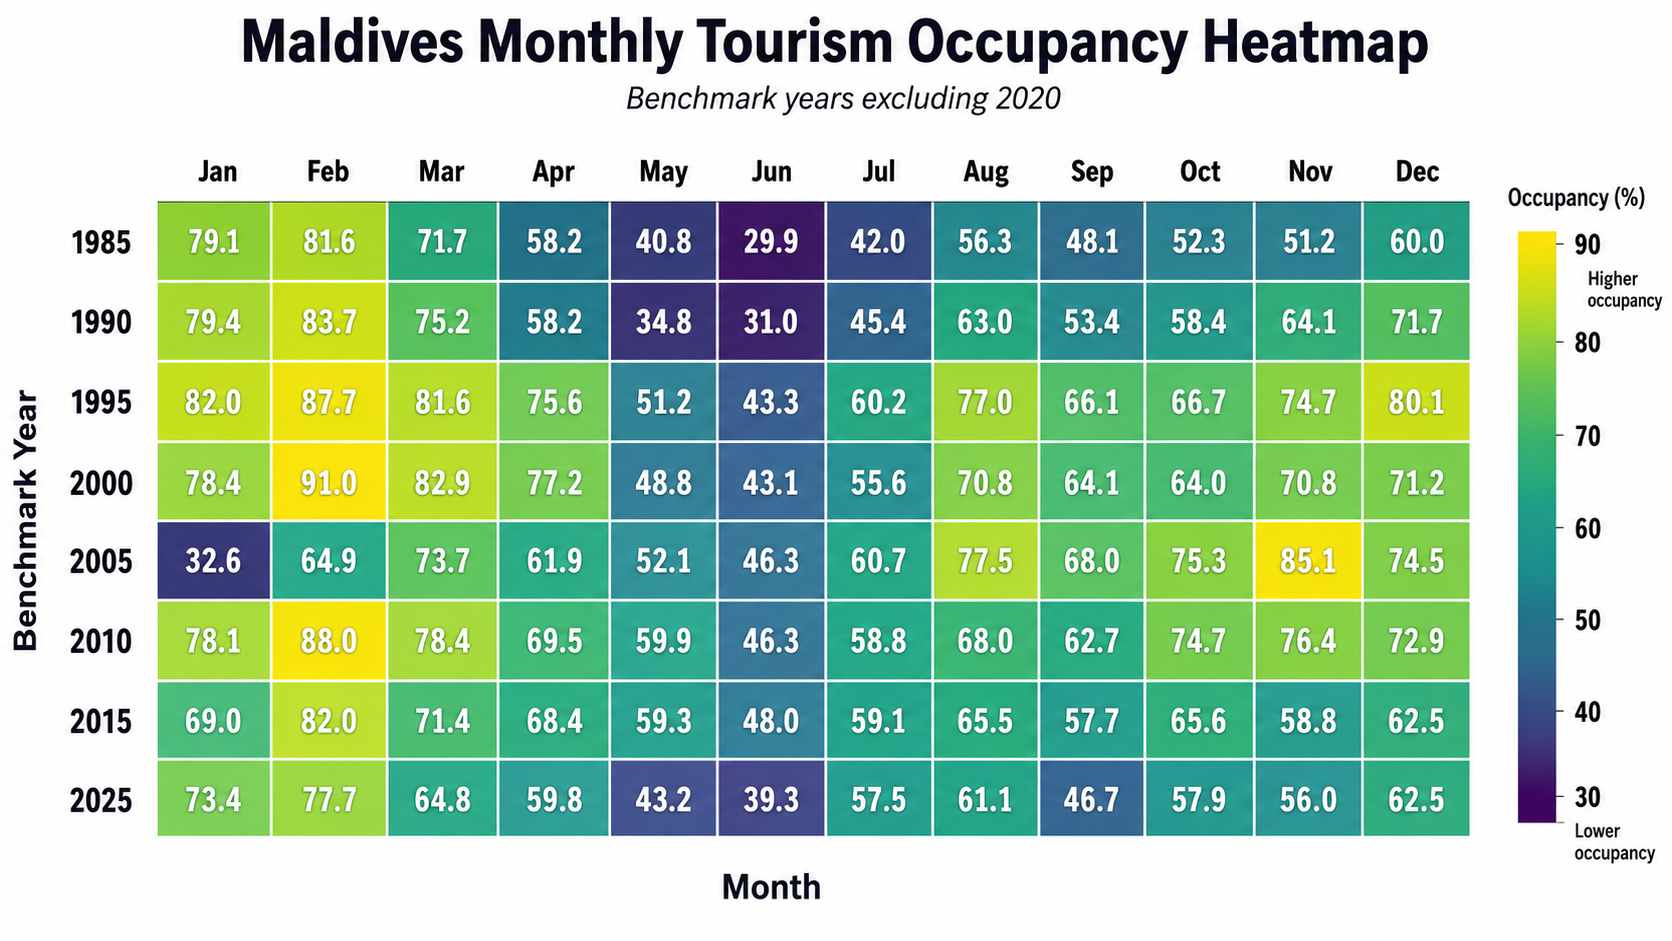
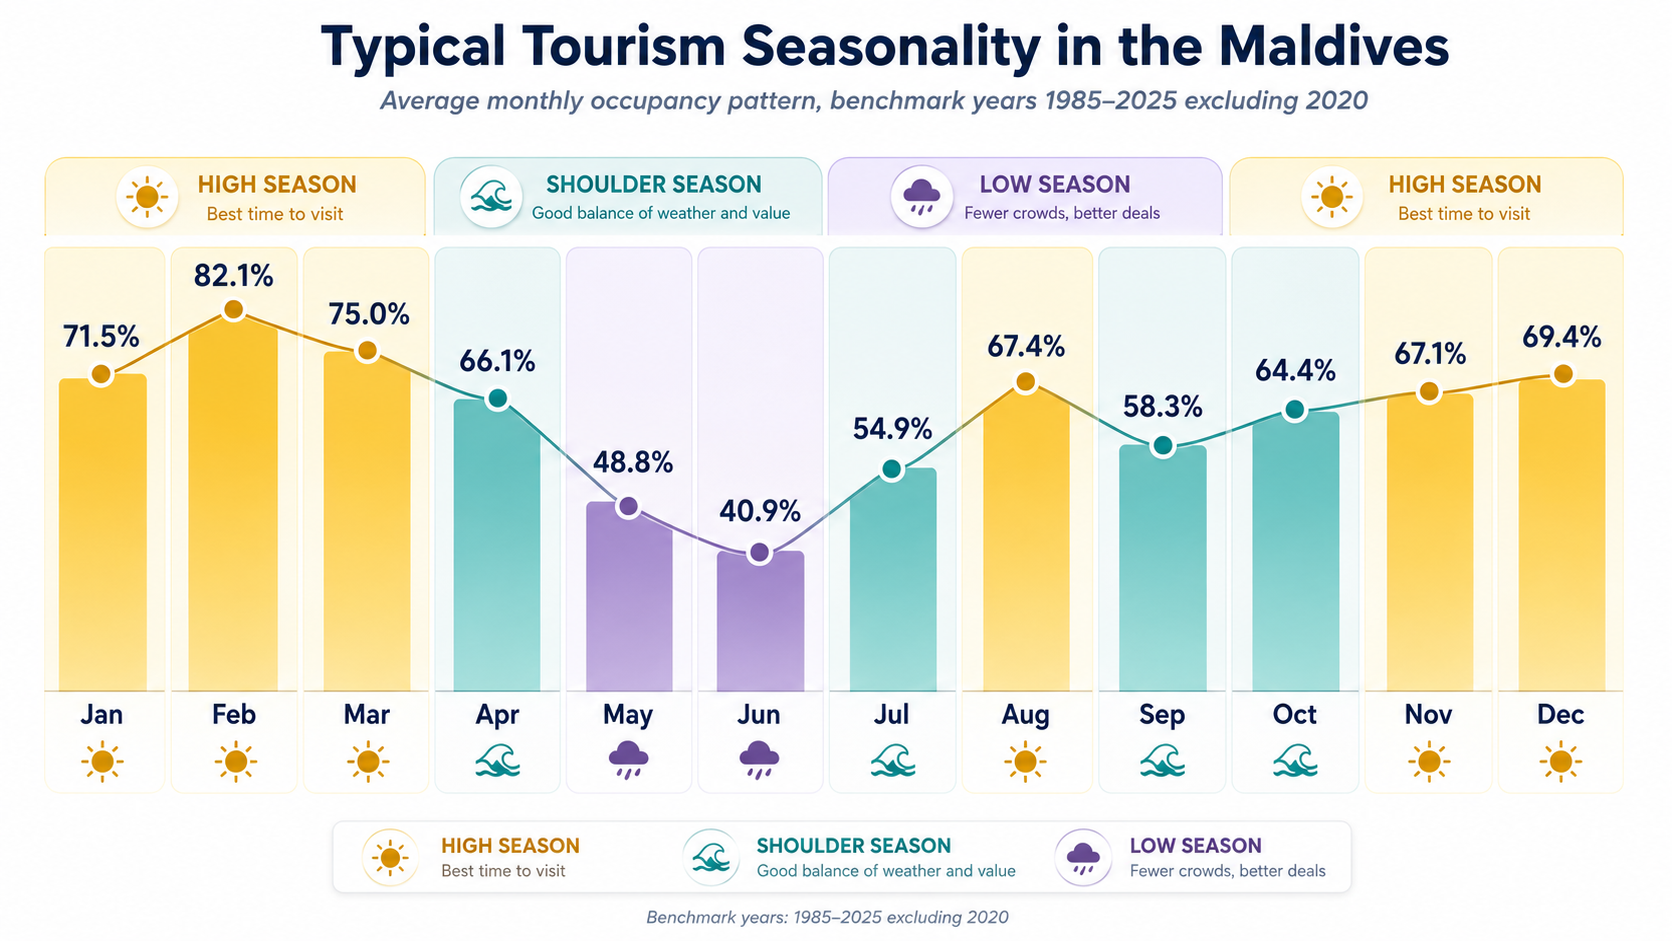
Source: Ministry of Tourism, Tourism Yearbook 2025; MMA. The figures provide a destination-level reference rather than a forecast for any individual island.
A guesthouse should not assume that record national arrivals, a strong high season or high resort occupancy automatically translates into strong demand for every local island. National occupancy provides the broad seasonal context; island-level demand, booking pace, lead time and the property’s own reservations provide the operational forecast.
My earlier research (Zuhuree, 2017) on Maldives guesthouse prices also identified clear seasonal price variation. This confirms that time is not merely a background condition. It is one of the characteristics incorporated into the price of a room. Rates should therefore respond to where the arrival date sits on the seasonal curve, while still being adjusted for the property’s actual booking performance.
2. Use a Best Available Rate as the anchor
The Best Available Rate, commonly called BAR, is the main flexible public rate available without membership or special eligibility conditions.
It should act as the centre of the pricing system.
A guesthouse might establish the following ladder:
Rate level | Illustrative base rate | Typical use |
|---|---|---|
Cost-protection floor | USD 82 | Internal boundary; not a routine public rate |
Low-demand BAR | USD 92 | Weak dates with adequate availability |
Standard BAR | USD 105 | Normal demand |
Strong-demand BAR | USD 120 | Pace ahead of forecast |
High-demand BAR | USD 138 | Limited inventory |
Peak BAR | USD 155 | Festive dates or exceptional compression |
These figures are illustrative. Each property must calculate its own floor and market position. The advantage of a ladder is discipline. Instead of inventing a new rate every morning, the operator moves one step when a defined trigger is reached.
For example:
demand strengthens: move from USD 105 to USD 120;
only two rooms remain: move to USD 138;
demand weakens: return one level, not immediately to the floor;
the cheapest room type sells out: close it rather than discounting a superior room.
Lead time tells you when demand becomes visible
Booking lead time is the number of days between reservation and arrival.
The latest Maldives Visitor Survey, covering 2025 and released in July 2026, reports that:
57% of respondents booked one to six months before arrival;
21% booked within four weeks; and
22% booked more than six months in advance.
European markets generally booked earlier, while Chinese and Indian visitors were more concentrated in shorter and medium booking windows.
Figure 2. Approximate cumulative booking curve from the Maldives Visitor Survey 2025.
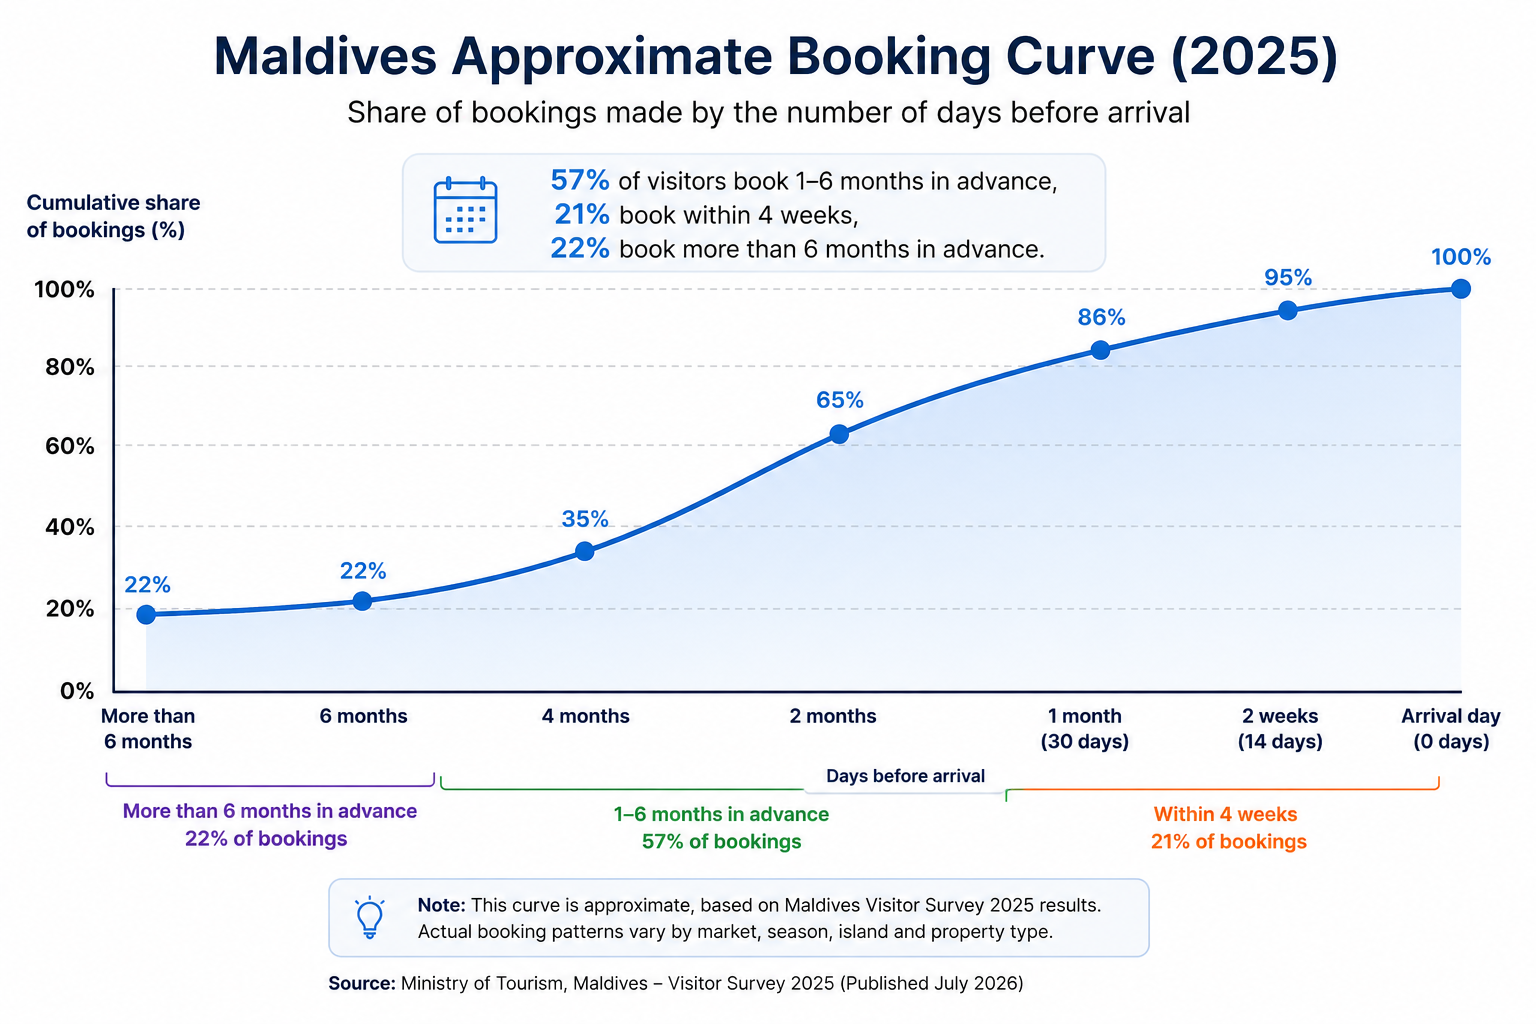
The curve is derived from reported booking-period ranges and should not be interpreted as exact daily booking data. The graph suggests that a large part of Maldives demand becomes visible between six months and one month before arrival. Yet meaningful bookings continue to arrive in the final weeks.
Guesthouse demand may form later than resort demand. In the December 2021 Visitor Survey, 12% of guesthouse-only visitors booked less than one week before travel, 11% booked one week ahead, 23% booked two to four weeks ahead and 33% booked one to two months ahead. The survey was conducted under unusual pandemic-era conditions, so these percentages should not be treated as a current universal pattern. They nevertheless show why guesthouses should monitor shorter booking windows carefully.
3. Booking pace is more useful than occupancy alone
Booking pace describes how quickly reservations accumulate for a future arrival date. Pickup is the number of additional bookings received between two observation dates.
Suppose a ten-room guesthouse reviews arrivals for the first week of February. Its historical forecast says:
Days before arrival | Expected rooms sold |
|---|---|
120 days | 12% |
90 days | 25% |
60 days | 42% |
30 days | 65% |
15 days | 78% |
Arrival | 88% |
At 60 days before arrival:
55% sold means demand is ahead of forecast;
42% sold means demand is on forecast;
28% sold means demand is behind forecast.
Figure 3. Comparing actual booking pace with the forecast.
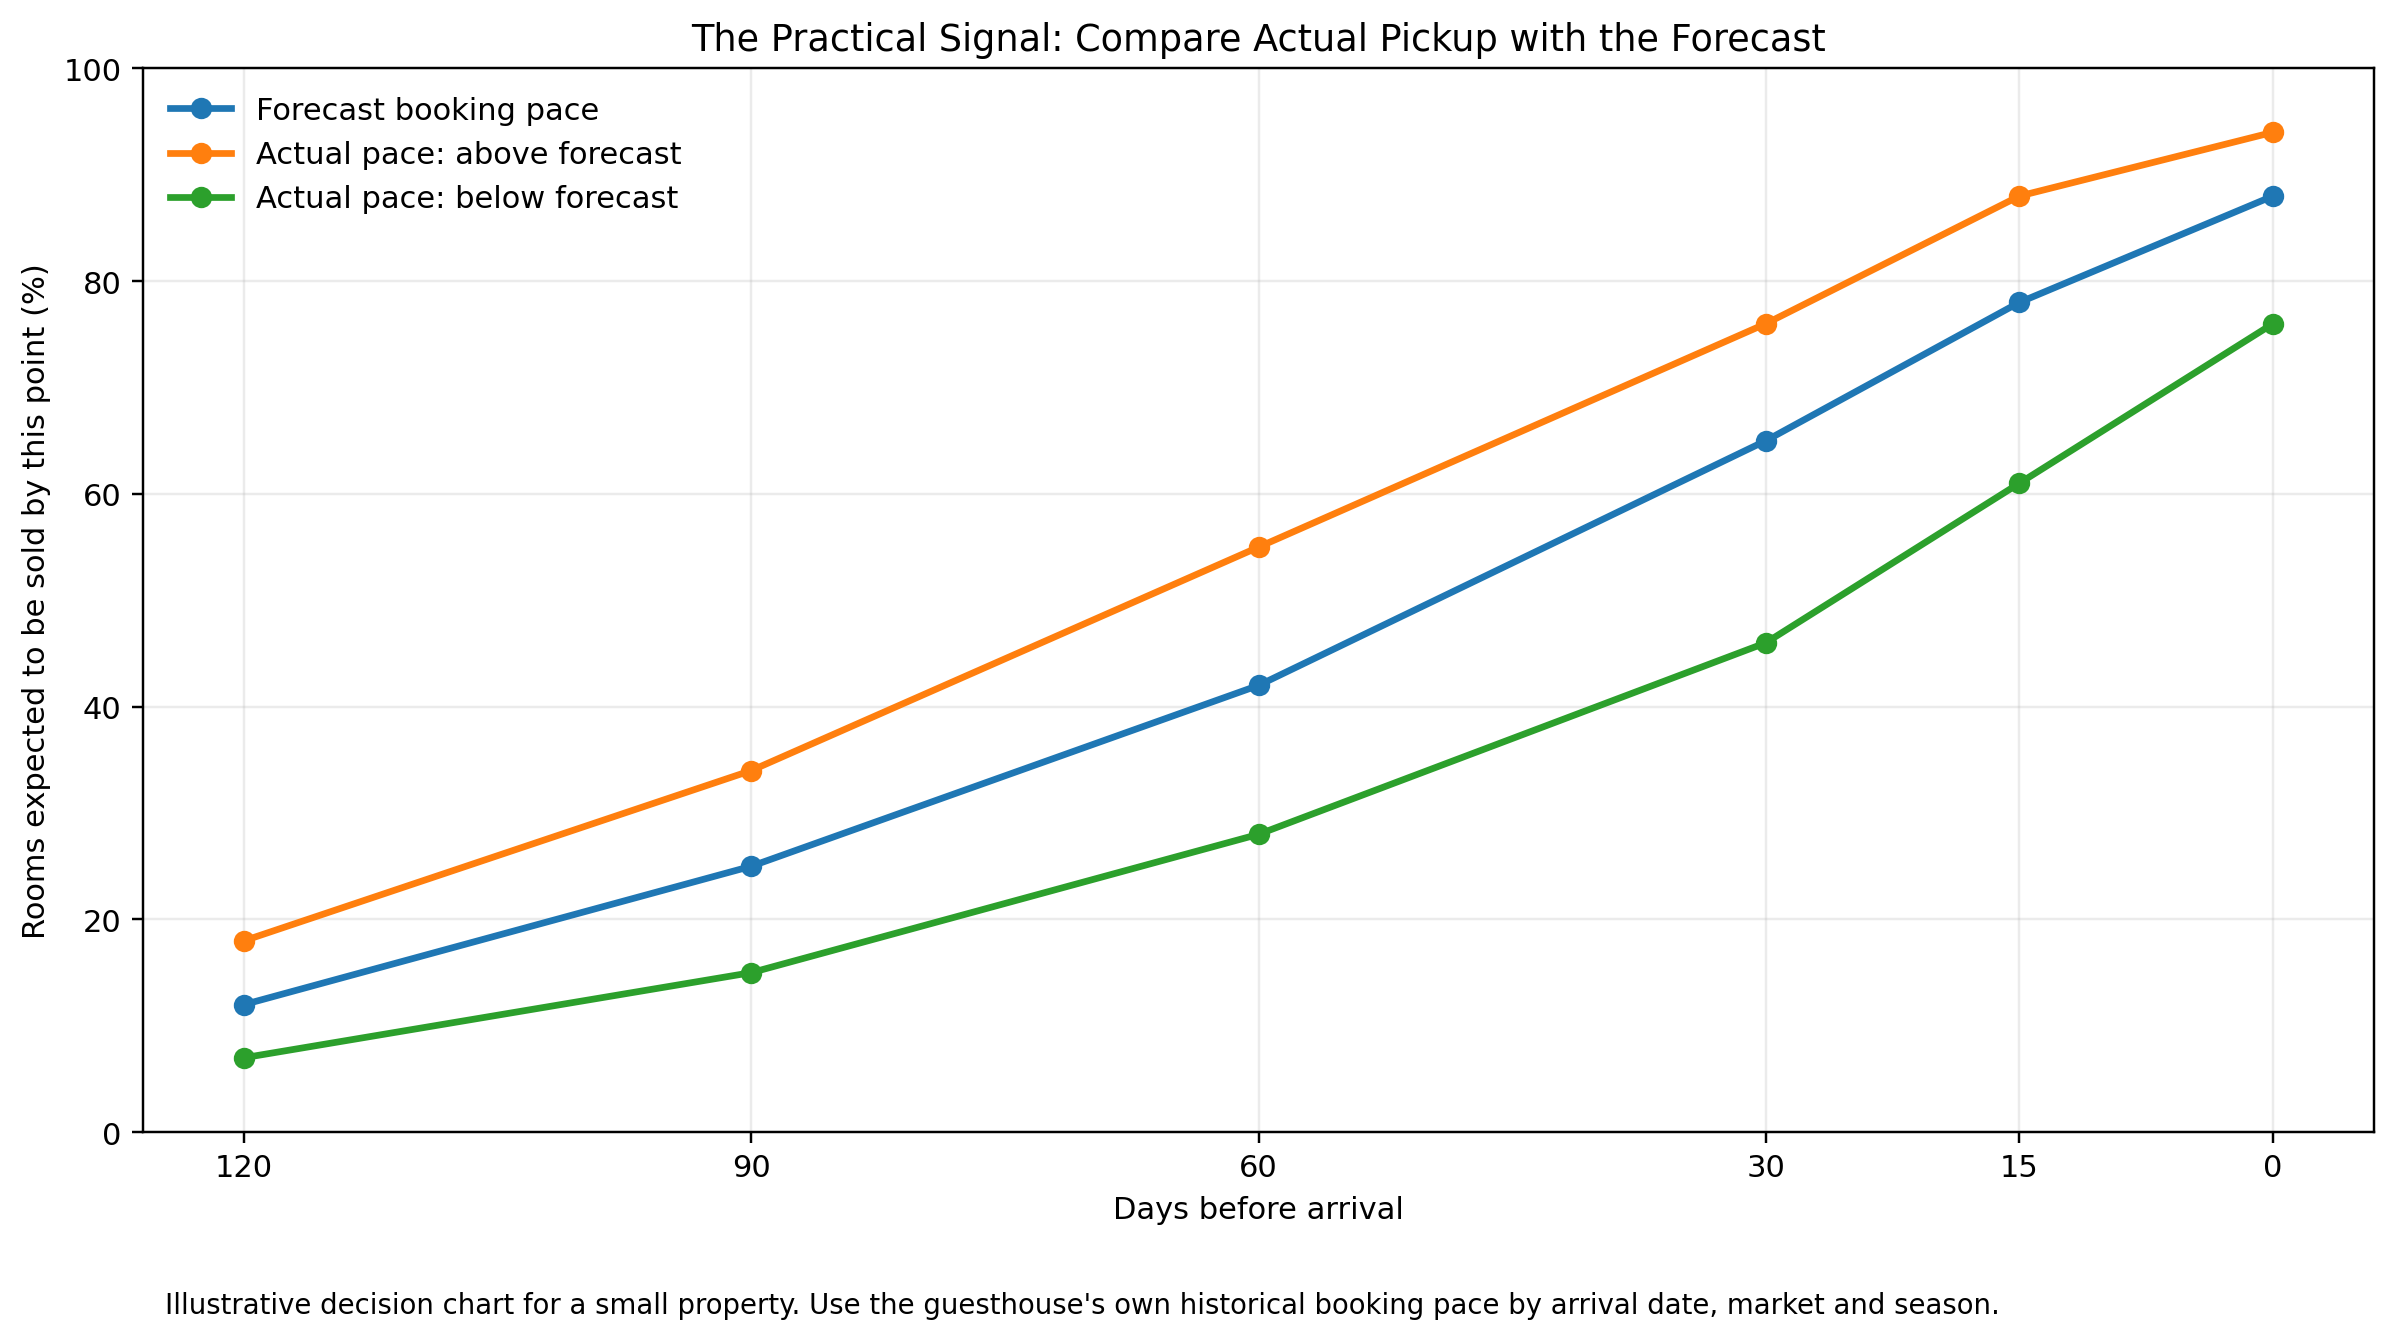
The example is illustrative. Each operator should construct curves from the property’s own reservations. A pace chart is an early-warning system. It can reveal weakening demand weeks before final occupancy appears disappointing.
Cornell research treats booking curves and pickup as core forecast inputs, although forecasting studies also show that no single technique is always best. Operators should measure forecast error and improve their method as more data become available.
The Booking Pace RatioThe first measure compares actual bookings with the number expected at the same point before arrival. Booking Pace Ratio = Actual rooms sold ÷ Forecast rooms sold Suppose the guesthouse expected 42% of rooms to be sold 60 days before arrival, but 55% have already been booked. Booking Pace Ratio = 55 ÷ 42 = 1.31 This means bookings are forming approximately 31% faster than forecast. A simple initial interpretation is:
These thresholds are starting points, not universal rules. A guesthouse should adjust them after examining how much normal variation exists in its own bookings. The same information can also be expressed as a percentage-point gap: Pace Gap = Actual booked share − Forecast booked share In the example: Pace Gap = 55% − 42% = 13 percentage points The ratio is useful for comparing different dates. The percentage-point gap is easier to communicate during a weekly review. The Booking Pressure IndexBooking pace should not be considered separately from remaining inventory. Being 20% ahead of forecast is more important when only two rooms remain than when eight rooms remain. A simple proposed measure is: Booking Pressure Index = Booking Pace Ratio ÷ Remaining inventory share Where: Remaining inventory share = Rooms remaining ÷ Total rooms Suppose a ten-room guesthouse is 60 days from arrival:
The Booking Pressure Index is: 1.31 ÷ 0.45 = 2.91 Now consider another date where:
The index becomes: 1.00 ÷ 0.80 = 1.25 The first date has substantially greater pricing pressure because bookings are arriving faster while inventory is becoming scarce. This index should initially be used to rank arrival dates, rather than to apply a universal threshold. Dates with the highest values deserve the closest attention and are stronger candidates for:
The measure becomes especially useful for a small property because one room can represent a large share of total capacity. |
4. Remaining inventory changes the value of the next room
Consider two guesthouses, each forecast to reach 80% occupancy. One has four rooms. The other has twenty. The first property may have only one room left to sell. The second may have four. Even with the same occupancy percentage, their inventory risk is different. When few rooms remain and booking pace is strong, the operator can:
raise the BAR;
close early-booking rates;
close mobile or member discounts;
require a longer stay on compressed dates; or
preserve the remaining room for a higher-value booking.
When many rooms remain and pace is weak, the first response should be diagnostic:
Is the property available on the correct dates?
Is the room mapped properly across channels?
Is the total price competitive?
Are photographs and descriptions convincing?
Are enquiries answered quickly?
Is the cancellation policy too restrictive?
Can value be added through breakfast, transfers or activities?
Only after these questions should the operator consider a price reduction.
The Hold-or-Sell ThresholdSometimes the guesthouse must choose between accepting a lower rate now and preserving the room for a possible higher-rate booking later. The decision can be expressed through expected revenue. Minimum probability of a later sale = Net rate available now ÷ Expected higher net rate Suppose:
The threshold is: 105 ÷ 138 = 0.761 The guesthouse should preserve the room only when it believes there is more than a 76% probability of selling it later at USD 138. If the estima
The estimate should be based on:
The calculation also explains why the same room may require different decisions at different times. At 120 days before arrival, waiting may be reasonable. At three days before arrival, the probability of receiving a better booking may have fallen sharply. |
Use early-booking rates selectively
An early-booking rate exchanges price for commitment. It may require:
booking 60 or 90 days ahead;
partial or full prepayment;
non-refundable or restricted cancellation;
a minimum stay;
selected travel dates; or
limited room allocation.
These conditions are known as rate fences. They allow a lower rate to reach a particular customer without reducing the price for everyone. International revenue-management practice uses booking time, flexibility, duration and customer characteristics as common rate fences.
Early-booking offers are useful when they:
establish a secure base for low or shoulder periods;
improve cash flow;
reduce uncertainty; or
attract markets that plan well in advance.
They are harmful when the guesthouse discounts dates that were already likely to sell at a higher rate.
5. Do not make last-minute discounts automatic
A discount that does not generate sufficient incremental demand reduces revenue without solving the demand problem.
As arrival approaches, the temptation to discount becomes stronger. Sometimes this is rational. An unsold room tonight earns nothing.
However, a lower rate is useful only when it generates an additional booking that would not otherwise occur. Broad discounting can simply give a cheaper room to a guest who was already prepared to book. Cornell research has repeatedly cautioned that indiscriminate rate-cutting can dilute revenue without creating enough incremental demand.
A last-minute offer should therefore be:
activated only when pace is below forecast;
limited to specific arrival dates;
visible to a targeted audience or channel;
short in duration;
protected from combining with other discounts; and
measured by net revenue after commission.
Before reducing the price, the property can offer a transfer credit, activity discount, meal upgrade or flexible checkout when these benefits create more perceived value than cost.
The Discount Recovery TestA discount is worthwhile only when it produces enough additional bookings to recover the revenue sacrificed on every room sold at the lower price. The required increase in occupied room-nights can be estimated as: Required booking increase = Current net rate ÷ Discounted net rate − 1 Suppose the current net room rate is USD 105 and the operator considers reducing it to USD 92. Required booking increase = 105 ÷ 92 − 1 Required booking increase = 14.1% The discount must therefore generate approximately 14% more occupied room-nights merely to maintain the same room revenue. This calculation should use net rates after OTA commission, payment costs and other channel deductions. For example, if a promotion also increases OTA exposure or commission, the required booking increase may be considerably higher. This produces a useful question before every promotion: Is there credible evidence that this discount will increase bookings by more than the recovery requirement? If the answer is uncertain, the operator should first consider improving:
A discount that does not generate sufficient incremental demand reduces revenue without solving the demand problem.The Discount Recovery Test A discount is worthwhile only when it produces enough additional bookings to recover the revenue sacrificed on every room sold at the lower price. The required increase in occupied room-nights can be estimated as: Required booking increase = Current net rate ÷ Discounted net rate − 1 Suppose the current net room rate is USD 105 and the operator considers reducing it to USD 92. Required booking increase = 105 ÷ 92 − 1 Required booking increase = 14.1% The discount must therefore generate approximately 14% more occupied room-nights merely to maintain the same room revenue. This calculation should use net rates after OTA commission, payment costs and other channel deductions. For example, if a promotion also increases OTA exposure or commission, the required booking increase may be considerably higher. This produces a useful question before every promotion: Is there credible evidence that this discount will increase bookings by more than the recovery requirement? If the answer is uncertain, the operator should first consider improving:
A discount that does not generate sufficient incremental demand reduces revenue without solving the demand problem. |
6. Use minimum stays when short bookings block stronger demand
A minimum length of stay requires the guest to book a specified number of nights.
It can be useful when:
demand is strong across consecutive dates;
a one-night booking would leave an unsellable gap;
room turnover is costly;
transfers make very short stays unattractive; or
a festival or holiday creates concentrated demand.
For example, accepting a one-night Saturday booking may prevent the property from selling a four-night Friday-to-Tuesday stay.
Minimum stays should not be imposed simply because the calendar says “high season.” They should respond to forecast demand across the full stay period. Length-of-stay controls are a standard revenue-management tool precisely because demand must be considered by both arrival date and duration.
Expected displacement valueThe same expected-value logic can support minimum-stay and group decisions. Expected displacement value = Probability of alternative booking × Net contribution from that booking Suppose a one-night reservation would generate USD 80 in contribution after variable and channel costs. Accepting it would block a possible four-night reservation generating USD 360 in contribution. If the probability of receiving the four-night booking is estimated at 30%: Expected displacement value = 30% × USD 360 = USD 108 Because USD 108 exceeds the USD 80 contribution from the one-night booking, preserving the room—or imposing a minimum stay—may be financially rational. If the probability of the longer booking were only 15%: 15% × USD 360 = USD 54 In that situation, accepting the one-night booking would produce the greater expected contribution. This calculation is particularly useful for:
|
7. Length-of-stay discounts must reflect real savings
Longer stays may reduce:
room-cleaning frequency;
linen changes;
check-in administration;
payment costs;
vacancy gaps; and
acquisition costs per occupied night.
A modest discount may therefore be justified. Yet a seven-night booking during a peak week may consume rooms that could have been sold individually at higher rates. The discount should depend on demand, not merely on the number of nights.
A practical rule is: Offer length-of-stay discounts when the operational savings and occupancy benefit exceed the lost room revenue.
8. Evaluate group rates by total contribution
A request for eight rooms can feel too valuable to refuse.
The correct question is not the group’s room rate alone. It is whether the group produces more total contribution than the bookings it may displace.
Consider:
number of rooms and nights;
meals;
excursions;
transfers;
guide or coordination costs;
complimentary rooms;
payment terms;
cancellation risk;
commission; and
alternative demand for the same dates.
During weak periods, a group can establish valuable base occupancy. During compressed dates, it may displace higher-rate independent guests. Cornell’s displacement approach compares group contribution with the value of transient demand that may have to be rejected.
A 20-minute weekly pricing routine
Every week, review each important arrival date at:
120, 90, 60, 30, 15 and 7 days before arrival.
Record:
Indicator | Question |
|---|---|
Rooms sold | How much inventory is already committed? |
Pickup | How many rooms were added since the last review? |
Forecast pace | Are bookings ahead, on or behind the expected curve? |
Remaining inventory | How many actual rooms remain? |
Current BAR | Which step of the rate ladder is open? |
Competitor movement | Have comparable properties changed rates or sold out? |
Channel mix | Are bookings arriving through profitable channels? |
Action | Raise, hold, improve value, open an offer or impose a stay control? |
Action checklist
Establish low, shoulder, high and peak demand periods.
Create one flexible Best Available Rate.
Build a rate ladder with five or six controlled levels.
Record booking lead time for every reservation.
Build separate pace curves for major seasons.
Measure pickup weekly.
Compare actual bookings with forecast—not only last year.
Raise rates when pace is stronger than expected.
Close cheap offers as inventory becomes scarce.
Diagnose visibility and value before discounting.
Protect early-booking rates with clear conditions.
Use last-minute offers only on weak dates.
Apply minimum stays when short bookings create displacement.
Base long-stay discounts on actual savings.
Evaluate groups using total contribution and displacement.
Record every pricing decision and review the result.
Read the Pace Before You Move the Rate
Revenue management is not the art of guessing tomorrow’s price. It is the practice of observing how demand forms through time.
A room rate should rise because bookings are accumulating faster than expected, inventory is becoming scarce or higher-value demand is likely. It should fall only when demand is genuinely weak and a carefully targeted intervention can produce additional profitable business.
The booking calendar is not merely a list of reservations. It is an instrument for seeing the future—imperfectly, but early enough to act.
Expected displacement valueThe same expected-value logic can support minimum-stay and group decisions. Expected displacement value = Probability of alternative booking × Net contribution from that booking Suppose a one-night reservation would generate USD 80 in contribution after variable and channel costs. Accepting it would block a possible four-night reservation generating USD 360 in contribution. If the probability of receiving the four-night booking is estimated at 30%: Expected displacement value = 30% × USD 360 = USD 108 Because USD 108 exceeds the USD 80 contribution from the one-night booking, preserving the room—or imposing a minimum stay—may be financially rational. If the probability of the longer booking were only 15%: 15% × USD 360 = USD 54 In that situation, accepting the one-night booking would produce the greater expected contribution. This calculation is particularly useful for:
|
A practical decision sequence
The mathematics can be reduced to four questions:
Are bookings ahead of or behind forecast?
Use the Booking Pace Ratio.How scarce is the remaining inventory?
Use the Booking Pressure Index.How much additional demand must a discount generate?
Use the Discount Recovery Test.Is waiting for a higher rate worth the risk?
Use the Hold-or-Sell Threshold.
Next in the series
How to Price Excursions Without Losing Money
The next article will examine boats, fuel, crew, equipment, minimum passenger numbers, weather risk and the cost of departing with empty seats.